About Hype Score
How much attention is a company receiving? Is a company more popular now than it was a year ago? What are the key events influencing this attention? Is IPO on the horizon?
The Hype Score provides a daily estimation of a company's news hype, rating it on a scale from 0 to 100 relative to its historical popularity.
To derive this score, we track mentions of Pre-IPO companies across leading news outlets. We employ sophisticated algorithms to sift through the news, disregarding irrelevant articles, and apply mathematical transformations to calculate the daily Hype Score.
Media hype meter
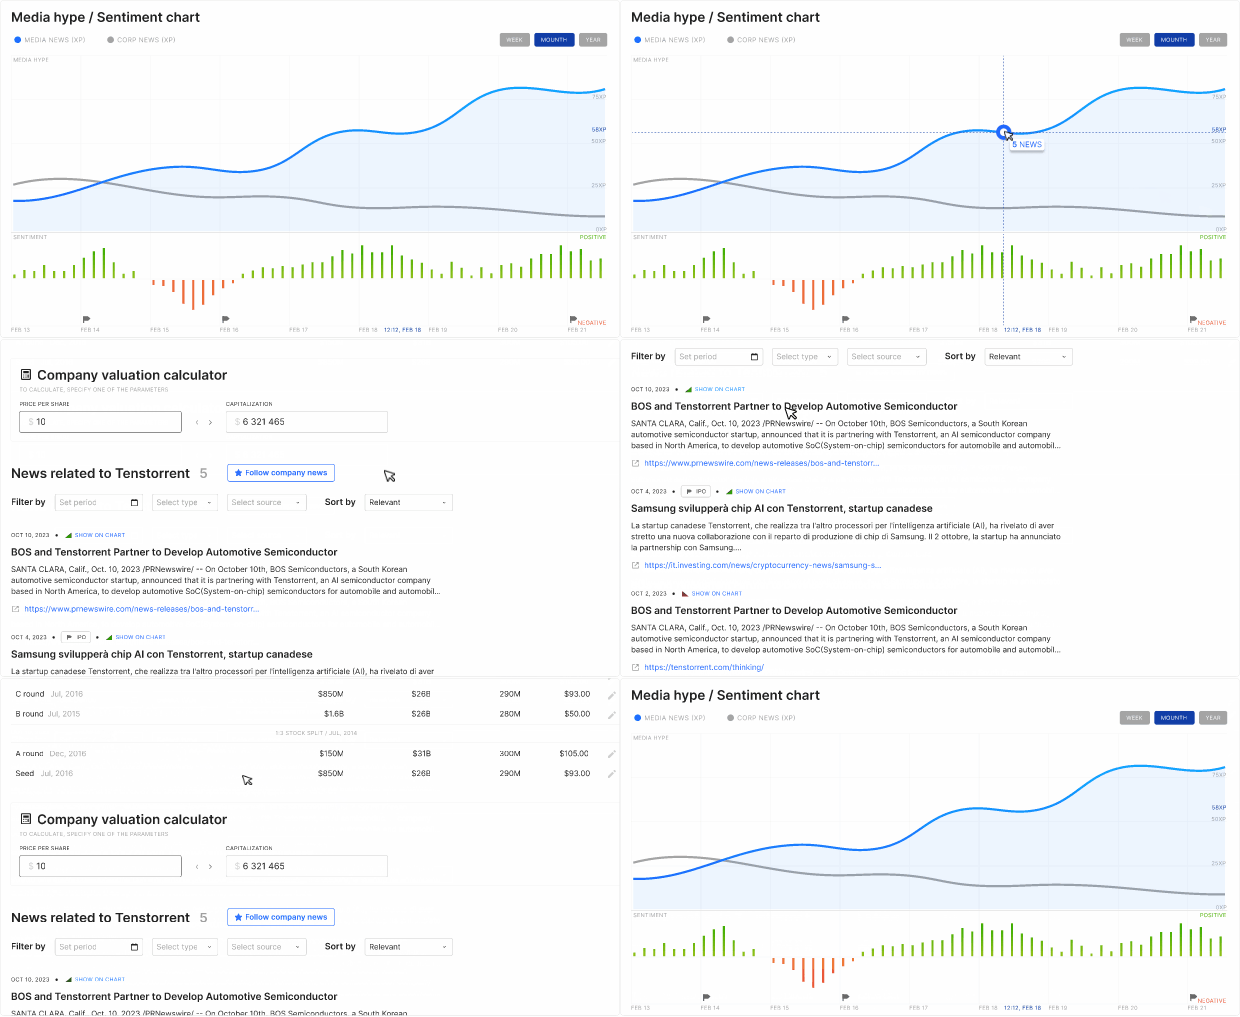
The NewsHeat chart offers an interactive way to see how hype developed over time. A rising trend might suggest increasing media efforts by the company, while a decline could indicate waning public interest. Notably, spikes in the chart often align with significant company events.

Click on any point in the chart to access news articles for that particular date!
You'll notice two types of hype on the chart: media hype (in blue) and corporate hype (in grey). Corporate hype consists of news directly from the companies, such as financial updates or product launches, providing a granular view of company activities that might not make the mainstream news.
The company news section consolidates all articles related to a company, allowing for efficient filtering by date, keyword, or source.

Data Preparation
We monitor around 100 prominent media outlets, from broad coverage to niche VC-focused sources. Every mention of Unicorn companies in headlines is tracked. However, not all mentions are relevant. For example, articles might use company names that are common words or mention companies in promotional content. We apply algorithms to filter out such cases.
If we get a very large number of articles for a company in one day, we apply further algorithms so that only the most important articles are shown in the company news section (although we still take the rest of the articles into account when calculating hype). This is done so that users do not have to sift through a vast number of articles each day.
Hype Calculation
The daily hype score XPj is calculated using the following formula:

Where nj stands for the quantity of news we received about a company today, nmin stands for the minimum historical daily quantity of news (usually 0), and nmax stands for the maximum historical daily quantity of news.
If the resulting value is not a whole number, we round it up. We also apply adjustments to smooth out fluctuations in the NewsHeat chart, ensuring that the hype score transitions gradually.
News Makes Prices Move
It is widely acknowledged that stock movements are influenced by news. This makes sense considering that most information we get about stocks comes from news and consequently it acts as a foundation in our decision making. Our aim here is to use new technology to help potential investors analyze news more quickly and comprehensively.
Numerous studies support the notion that news impacts stock prices. For example, Ferguson et al. (2015) show that both the volume and the tonality of news articles influence stock returns, with volume having a more pronounced effect. Wu and Lin (2017) come to a similar conclusion using a subset of Taiwanese firms, emphasizing that positive or negative coverage in the media is related to the respective sign of abnormal returns.
АNews analysis is also helpful when predicting commodity prices. Bonaparte, Fabozzi, and Koslowsky (2020) use media information to construct an oil volatility index that beats analogous indices which do not rely on news data. Kim, Cha, and Lee (2017) successfully predict food prices based on Twitter mentions. Banerjee et al. (2024) observe a general influence of media hype on commodity prices.
Thus, news does not just move stocks but prices in general.
With the hype score, we aim to provide an indicator that will complement the decision making of VC investors. One of the advantages of the hype score is that it is calculated for each company independently, unlike many of the stock market indicators which are based on aggregate measures. Considering that private markets are generally less transparent, the ability to analyse news feeds for each company separately may prove valuable.
It is important to note that lots of mentions in the media is not necessarily a good thing. One possibility is that extensive media coverage stems from negative events. Another possibility is that media hype may cause a company’s valuation to become unreasonably inflated. Some research even suggests that high media coverage in Pre-IPO companies leads to lower returns in the initial period after IPO (Liu, Sherman, and Zhang, 2007; Chen et al., 2019). Although our score is not absolute, i.e. it compares the level of hype relative to a company’s own maximum and not relative to other companies, it is still important to understand its limitations.
For this reason, we strongly encourage you to consider a variety of factors when forming your opinion. You may find our website useful for this purpose as it provides a lot of relevant information, including funding history, the sentiment score that indicates whether news coverage is negative or positive, and the valuation calculator that makes it easy to calculate valuation based on the share price.
References
- Banerjee, A. K., Şensoy, A., Goodell, J. W., & Mahapatra, B. (2024). Impact of media hype and fake news on commodity futures prices: A deep learning approach over the COVID-19 period. Finance Research Letters, 59, 104658. https://doi.org/10.1016/j.frl.2023.104658
- Bonaparte, Y., Fabozzi, F. J., & Koslowsky, D. (2020). Can commodity price uncertainty indexes be improved by capturing media information? The case of oil price uncertainty. Journal of Alternative Investments, 22(4), 41–58. https://doi.org/10.3905/jai.2020.1.094
- Chen, Y., Goyal, A., Veeraraghavan, M., & Zolotoy, L. (2019). Media Coverage and IPO Pricing around the World. Journal of Financial and Quantitative Analysis, 55(5), 1515–1553. https://doi.org/10.1017/s0022109019000486
- Ferguson, N. J., Philip, D., Lam, H. Y. T., & Guo, J. (2015). Media content and stock Returns: The Predictive Power of press. Multinational Finance Journal, 19(1), 1–31. https://doi.org/10.17578/19-1-1
- Kim, J., Cha, M., & Lee, J. G. (2017). Nowcasting commodity prices using social media. PeerJ. Computer Science, 3, e126. https://doi.org/10.7717/peerj-cs.126
- Liu, L. X., Sherman, A. E., & Zhang, Y. (2007). Media coverage and IPO underpricing. Social Science Research Network. https://doi.org/10.2139/ssrn.972776
- Wu, C., & Lin, C. (2017). The impact of media coverage on investor trading behavior and stock returns. Pacific-basin Finance Journal, 43, 151–172. https://doi.org/10.1016/j.pacfin.2017.04.001
 xIPOmeter